Wolfram|Alpha’s Facebook analytics ranks high among our all-time most popular features. By now, millions of people have used Wolfram|Alpha to analyze their own activity and generate detailed analyses of their Facebook friend networks. A few years ago, we took data generously contributed by thousands of “data donors” and used the Wolfram Language’s powerful tools for social network analysis, machine learning, and data visualization to uncover fascinating insights into the demographics and interests of Facebook users.
At the end of this month, however, Facebook will be deprecating the API we relied on to extract much of this information.

Photography by Tracy Howl and Paul Clarke
Has our newfound massive availability of data improved decisions and lead to better democracy around the world? Most would say, “It’s highly questionable.”
Conrad Wolfram’s TEDx UK Parliament talk poses this question and explains how computation can be key to the answer, bridging the divide between availability and practical accessibility of data, individualized answers, and the democratization of new knowledge generation. This transformation will be critical not only to government efficiency and business effectiveness—but will fundamentally affect education, society, and democracy as a whole.
Wolfram|Alpha and Mathematica 10 demos feature throughout—including a live Wolfram Language generated tweet.
More about Wolfram’s solutions for your organization’s data »
 2
2
For many of us, the end of summer is a time of change. You might be going to college, starting a new year of school, or taking a new job. Even if you’re not, there’s a decent chance that you’re still meeting some new friends and living a little bit differently in general. We’ve previously looked at what Wolfram|Alpha Personal Analytics for Facebook can tell us about the evolution of our society, but we can also use Personal Analytics to inform us about how we change over time as individuals. More »
 19
19
We here at Wolfram are, by and large, a bunch of nerds. This shouldn’t be that surprising, especially after looking at the people and fictional characters we’ve turned into mathematical curves on Wolfram|Alpha. Our curves of internet memes, cartoon and video game characters, celebrities, and mathematical formulas have been incredibly popular. As many of our fellow nerds get ready to go back to school, we’re celebrating nerddom and showing our appreciation for Wolfram’s users—by letting one of you decide the next curve to be featured in Wolfram|Alpha. More »
 6
6
More than a million people have now used our Wolfram|Alpha Personal Analytics for Facebook. And as part of our latest update, in addition to collecting some anonymized statistics, we launched a Data Donor program that allows people to contribute detailed data to us for research purposes. More »
 2
2
Superlatives, like hyperbole, are my favorite thing. So it is with the greatest excitement that I am devoting this blog post to superlatives and range searching, as Wolfram|Alpha has again expanded its functionality in these areas.
I once heard from an actor pretending to be a scientist that the denser an element is, the better that element is for fighting terrible monsters. I cannot speak on the accuracy of that statement, as I am not an actor pretending to be a scientist, but if you wanted to apply superlatives to chemistry, Wolfram|Alpha can do that. More »
 25
25
Today we’re excited to announce the first upgrade to Wolfram|Alpha’s Personal Analytics for Facebook. There’s much more to analyze, see, and do—here’s a quick look! More »
The US elections are over, and with a few exceptions, we can now answer the question “What happened?” We know who won the 2012 presidential election, we know there was an upset in the Massachusetts senate race, and we know that Republicans maintained control of the House of Representatives. So now, whatever race you’re most concerned about, the big question is, “Why did it happen?” More »
 11
11
Wolfram|Alpha answers millions of queries every day. For instance:
 49
49
Note added: Since this blog was written, Facebook has modified their API to make much less information available about Facebook friends. While I think adding privacy controls is a good idea, what Facebook has done reduces the richness of the results that Wolfram|Alpha Personal Analytics can give for Facebook users.
After I wrote about doing personal analytics with data I’ve collected about myself, many people asked how they could do similar things themselves.
Now of course most people haven’t been doing the kind of data collecting that I’ve been doing for the past couple of decades. But these days a lot of people do have a rich source of data about themselves: their Facebook histories. More »
 4
4
In spring 2011, while adding the finishing touches to my PhD dissertation, I decided to enroll in the Wolfram Science Summer School (then called the NKS Summer School). I never suspected that my project at the Summer School would lead to a job and my involvement in one of the central features of Wolfram|Alpha Pro.
During my years as a graduate student I had the chance to live in three different countries and experience different working environments: other than my native Italy, I lived in Paris, where my PhD was based at ENS, and in Princeton, where I was lucky enough to spend time at the Institute for Advanced Study. However, at the end of my PhD, I felt that most of my interest in what I was doing was gone and that I needed to try something new.
Once at the Summer School, I had the chance to meet and chat with Stephen Wolfram as he helped me come up with a problem to work on. One of the first things I told him was that I was weary of open-ended academic kinds of problems and I was afraid no one was ever going to read my papers. I said that I wanted to deal with intellectual challenges, but I also wanted to tackle something that had a clear beginning and end. More »
 16
16
It’s a sad but true fact that most data that’s generated or collected—even with considerable effort—never gets any kind of serious analysis. But in a sense that’s not surprising. Because doing data science has always been hard. And even expert data scientists usually have to spend lots of time wrangling code and data to do any particular analysis.
I myself have been using computers to work with data for more than a third of a century. And over that time my tools and methods have gradually evolved. But this week—with the release of Wolfram|Alpha Pro—something dramatic has happened, that will forever change the way I approach data.
The key idea is automation. The concept in Wolfram|Alpha Pro is that I should just be able to take my data in whatever raw form it arrives, and throw it into Wolfram|Alpha Pro. And then Wolfram|Alpha Pro should automatically do a whole bunch of analysis, and then give me a well-organized report about my data. And if my data isn’t too large, this should all happen in a few seconds.
And what’s amazing to me is that it actually works. I’ve got all kinds of data lying around: measurements, business reports, personal analytics, whatever. And I’ve been feeding it into Wolfram|Alpha Pro. And Wolfram|Alpha Pro has been showing me visualizations and coming up with analyses that tell me all kinds of useful things about the data.
One year ago this week we sent out our first Wolfram Fun Fact! Since then, we have tweeted nearly 200 Wolfram|Alpha-computed facts, gained over 10,000 followers, and received some pretty amazing submissions from those followers.
To celebrate our first birthday, we thought we would share some of our favorite and most popular Wolfram Fun Facts from the past year:
round(log_12(vitaminC in a cubic light year of coffee/kg)))= meaning of lifehttp://bit.ly/hl98zt #FunFact— Wolfram Fun Facts (@WolframFunFacts)March 16, 2011
 9
9
Today we are pleased to share that ChaCha, the #1 free real-time question and answer service, has enhanced the depth, accuracy, and speed of its online and mobile Q&A service by adding computational knowledge from Wolfram|Alpha. The Wolfram|Alpha integration provides ChaCha users with instantly computed facts and answers to questions from over 100 topic areas, such as demographics, definitions, mathematics, geography, and celebrity facts.
ChaCha has historically used people to answer difficult questions to ensure a high-quality answer. We think ChaCha’s decision to incorporate Wolfram|Alpha, the world’s largest curated data repository, made accessible via free-form queries, is a natural extension of ChaCha’s service. Our match up with ChaCha also opens up Wolfram|Alpha to the larger community serviced by SMS mobile text messaging.
“At ChaCha we are constantly looking at ways in which we can better our users’ experience and provide the fastest and most accurate answers to their questions,” said Scott Jones, ChaCha’s CEO. “By partnering with Wolfram|Alpha and tapping into their vast database of computational knowledge, we are enhancing the scope and efficiency of our service.”
On the first day of integration, Wolfram|Alpha answered 32,000 of ChaCha’s incoming questions in a wide range of topics through ChaCha’s SMS service and mobile app. For example, need some quick homework help? Text “what is the inverse of Xlog3(4)?” to 242-242, and in just seconds ChaCha will text you the correct answer:

Or download the ChaCha mobile app and get Wolfram|Alpha-powered responses, such as “How old is Snoop Dogg?”:

We’re looking forward to providing unique and dynamically computed facts to the ChaCha Community!
 6
6
In 2010, our friends at the World Bank opened up their highly regarded World Development Indicators (WDI) database, making hundreds of economics, education, health, and other indicators free to download and explore. As part of our own mission to make data more accessible and comprehensible, we’re pleased to announce that we’ve been steadily adding WDI and other World Bank data to Wolfram|Alpha, so you can answer thousands of new questions about key components of global development.
One of the first sets we tackled was data on labor and employment, which means Wolfram|Alpha can now generate some quite detailed computations and comparisons of employment-related data for most of the world’s countries and territories. Try an input like “fraction of people working in agriculture in US, Russia, and Japan” to see find out how much less agrarian these economies have become over time. More »
 5
5
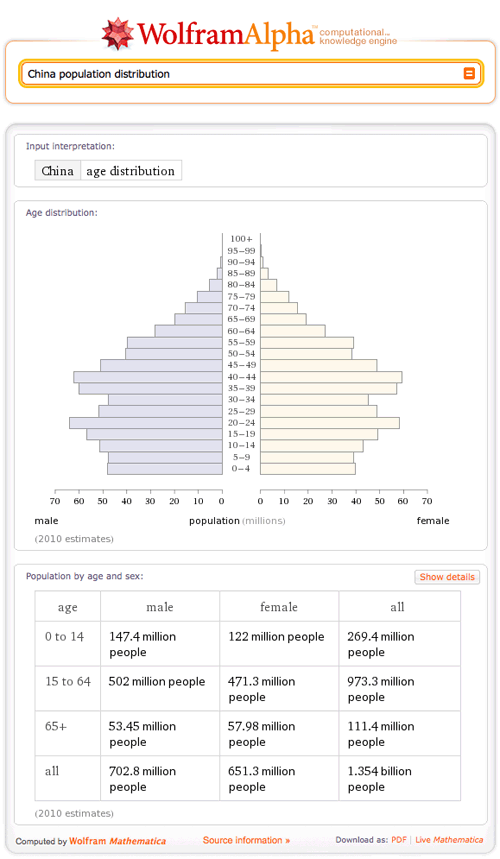
By popular demand, Wolfram|Alpha recently expanded population data for most of the world’s countries, based in part on statistics from the United Nations Population Division. Populations are shaped by factors such as disease, war, genocide, and famine as well as more benign phenomena such as immigration. One of the more common user requests in this area has been to support queries like “China population distribution”, which now returns an age pyramid and detailed table of population by age and sex:
You can also query for specific age groups, as indicated on the pyramid, or just query for a single age, and Wolfram|Alpha will return data for the appropriate five-year age “bin”:
More »
 5
5
Last year, we showed you how Wolfram|Alpha could help you explore some interesting historical statistics about federal income taxes in the United States. We’ve picked up the latest available figures from the Internal Revenue Service (IRS) through the 2008 tax year, so you can revisit that data and see if previous years’ trends have held up.
Wolfram|Alpha still can’t do your taxes (and if you haven’t finished them yet, don’t forget you’ve got until Monday to file)… but it can compute some very interesting new facts about income taxes in the US. There’s been a lot of discussion and debate this year about state-level corporate and individual taxes and their impact on budgets and the overall business climate in any given state. So we’ve added data on the maximum and minimum individual and corporate tax rates in each US state, which means Wolfram|Alpha can now compute rankings and summary statistics about “income tax rates in US states” or perform a comparison of the “highest corporate income tax rates in Illinois, Iowa, and Indiana”.
 2
2
When you roll dice, all numbers have the same probability to show up (assuming that the dice aren’t loaded in any way):
However, the leading digits of numbers in very large accumulated datasets—for example, the amount you pay for each household bill over the course of a year—follow a very different pattern. In such cases it is much more likely that a given number will start with one, with decreasing probability for each higher digit up to nine. This statistical phenomenon is called Benford’s law. More »
 8
8
As temperatures start falling across the U.S., many of us are looking more closely at our home heating and energy bills, wondering how much they might go up this winter. Wolfram|Alpha can’t yet predict the future, but now it can help you explore historical and recent energy-price trends in most U.S. states, thanks to data from the U.S. Energy Information Administration (EIA).
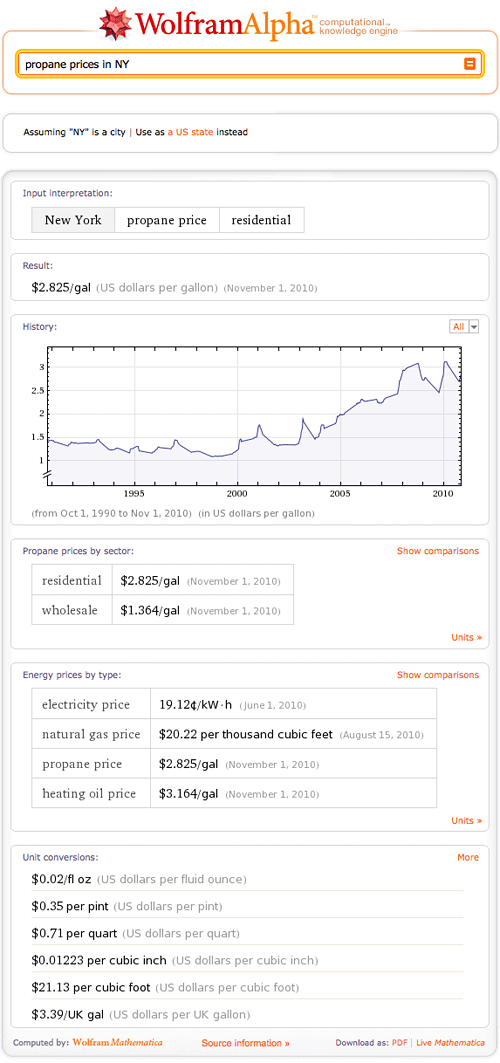
Ask Wolfram|Alpha about “heating oil prices in New York”, for example, and you’ll see that as of November 1, the statewide average price was about $3 per gallon—slightly higher than at the start of last winter, but quite a bit below the peak in late winter of 2008. Propane prices are also higher than a year ago, and you can also see that prices climbed dramatically over the course of last winter. You can keep checking back over the course of the season to see which way prices are trending in your state.
(Note that the jagged appearance of heating oil and propane plots is due to the fact that prices are only reported for part of the year; these prices are also reported for only about 20, mostly northern, U.S. states.)
You can also ask Wolfram|Alpha about natural gas and electricity prices. The EIA keeps these figures less up to date than figures for heating oil and propane, but you can clearly see long-term price trends and seasonal fluctuations for both of them. More »
 5
5
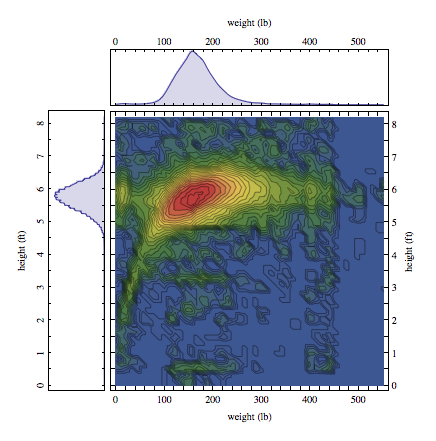
Based on the vast number of queries we have been receiving from users all around the world, we thought it would be very interesting to draw some inferences from it. We started with “Human Body Measurements”, one of the many topic areas in Wolfram|Alpha. We thought it would be a safe assumption to make that in more cases than not, when users query for data based on weight or height values, they are most likely looking for data about themselves (narcissism, thy name is Homo sapiens). Based on this assumption, we plotted all of the height and weight inputs and ended up with the following distribution:

We can see from this that the average Wolfram|Alpha user is an individual who weighs about 154 pounds and is between 5′ 9″ and 5′ 11″ tall. This translates to a BMI of between 21.5–22.7 for men or women. From these results, we see that the average user falls within normal distribution.
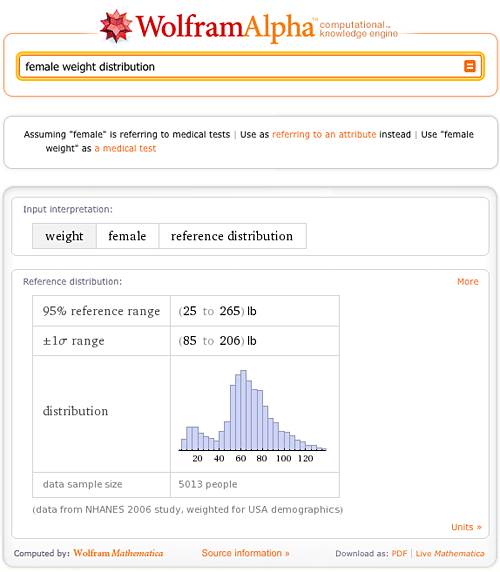
Let us see how this hypothetical Wolfram|Alpha user compares with the average American male or female:
Similarly, we can compare user heights with the height distribution of the general population in America: More »
 7
7
A new school year is here, and many students are diving into new levels of math. Fortunately, this year, you have Wolfram|Alpha to help you work through math problems and understand new concepts. Wolfram|Alpha contains information from the most basic math problems to advanced and even research-level mathematics. If you are not yet aware of Wolfram|Alpha’s math capabilities, you are about to have a “wow” moment. For the Wolfram|Alpha veterans, we have added many math features since the end of the last school year. In this post, we’re highlighting some existing Wolfram|Alpha math essentials, such as adding fractions, solving equations, statistics, and examples from new topics areas like cusps and corners, stationary points, asymptotes, and geometry.
You can access the computational power of Wolfram|Alpha through the free website, via Wolfram|Alpha Widgets, with the Wolfram|Alpha App for iPhone, iPod touch, and the iPad! Even better, the Wolfram|Alpha Apps for iPhone, and iPod touch, and the iPad are now on sale in the App Store for $0.99 though September 12.
If you need to brush up on adding fractions, solving equations, or finding a derivative, Wolfram|Alpha is the place to go. Wolfram|Alpha not only has the ability to find the solutions to these math problems, but also to show one way of reaching the solution with the “Show Steps” button. Check out the post “Step-by-Step Math” for more on this feature.
You can find this widget, and many others, in the Wolfram|Alpha Widget Gallery. Customize or build your own to help you work through common math problems. Then add these widgets to your website or blog, and share them with friends on Facebook and other social networks.
Of course, Wolfram|Alpha also covers statistics and probability. For example, Wolfram|Alpha can compute coin tossing probabilities such as “probability of 21 coin tosses“, and provides information on normal distribution: More »


