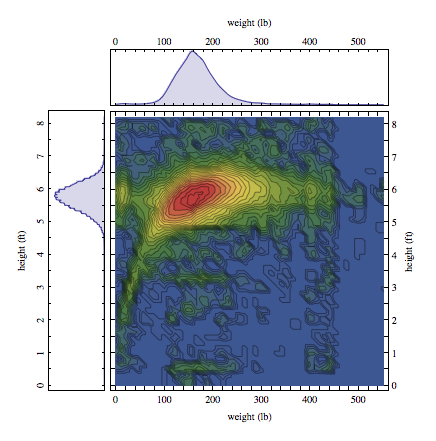
Based on the vast number of queries we have been receiving from users all around the world, we thought it would be very interesting to draw some inferences from it. We started with “Human Body Measurements”, one of the many topic areas in Wolfram|Alpha. We thought it would be a safe assumption to make that in more cases than not, when users query for data based on weight or height values, they are most likely looking for data about themselves (narcissism, thy name is Homo sapiens). Based on this assumption, we plotted all of the height and weight inputs and ended up with the following distribution:

We can see from this that the average Wolfram|Alpha user is an individual who weighs about 154 pounds and is between 5′ 9″ and 5′ 11″ tall. This translates to a BMI of between 21.5–22.7 for men or women. From these results, we see that the average user falls within normal distribution.
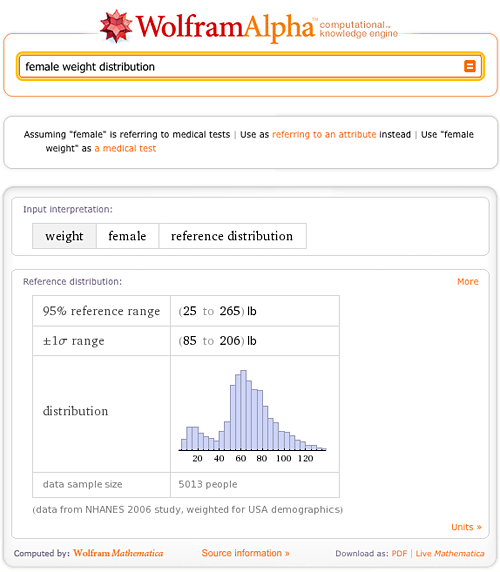
Let us see how this hypothetical Wolfram|Alpha user compares with the average American male or female:
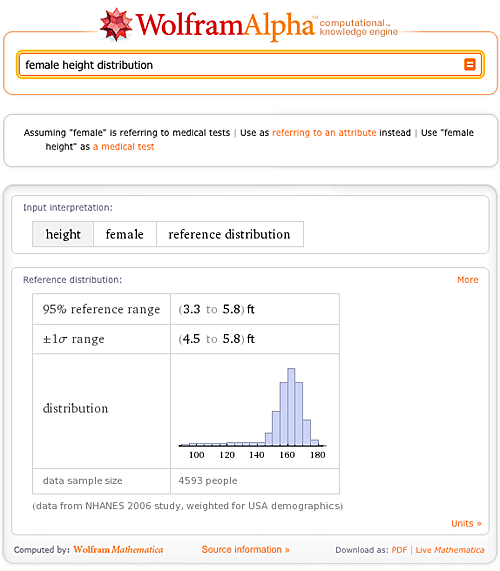
Similarly, we can compare user heights with the height distribution of the general population in America:
Being the world’s first computational knowledge engine enables us to do many interesting analyses, so we encourage our users to watch out for more cool data evaluations like these.
Parabéns pelo site professor!! Gostei muito.
Bjs
Where did you get the data used for the 2-D histogram? It’s hard to believe that there would be anyone 1 foot tall weighing 400 pounds.
If I could get the data, I could investigate it in Mathematica.
Hello George! Yes, it is obviously very unlikely for someone to be 1 foot tall and weigh 400 lbs. The data we present is a record of all the queries input by our users and this includes users trying to look at the results for unreal scenarios. This is what results in the outliers that we observe. But looking at the distribution we can make a reasonable assumption that the majority of the people who queried for sensible height/weight combinations are most likely to have queried for their own values or for someone known to them. And thus we are making some inferences based on those data points. The user query data is, by no means, representative of the actual distribution of people in the US.
To a first approximation, a person can be represented by a sphere, whose radius is proportional to the height. Assuming constant density, the weight of the person should then be proportional to the cube of his or her height. It’s hard to tell from the 2D plot, but it would be interesting to see how well your data follow the “weight is proportional to height^3” rule. It looks like it might hold over some range of heights, say between 4′ and 6′.
It looks as though your distribution plots of male and female weight and height have different units than the 95% and +-1sigma ranges. E.g., for the heights, the values are in feet, but it looks like the horizontal axis on the plot is in cm. Surely not intentional, eh?


 Comments Off


