 8
8
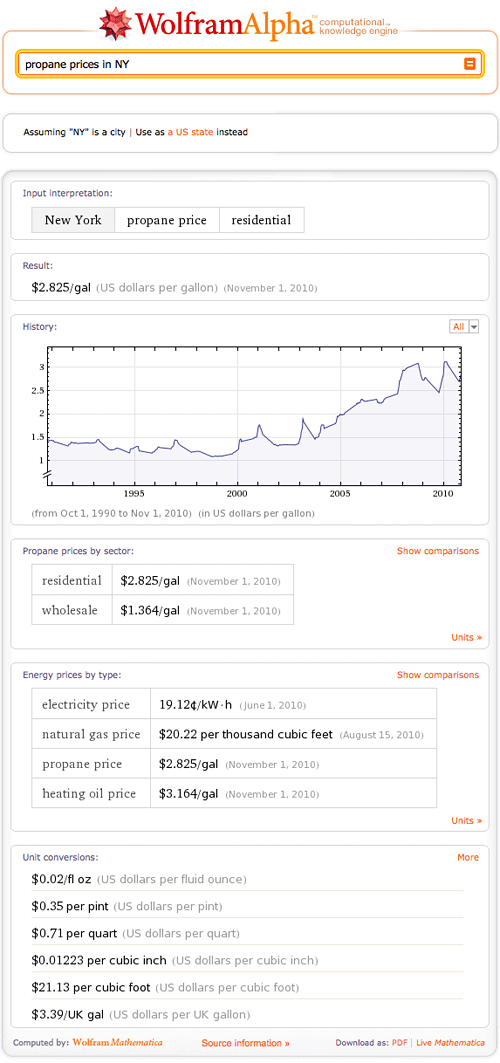
As temperatures start falling across the U.S., many of us are looking more closely at our home heating and energy bills, wondering how much they might go up this winter. Wolfram|Alpha can’t yet predict the future, but now it can help you explore historical and recent energy-price trends in most U.S. states, thanks to data from the U.S. Energy Information Administration (EIA).
Ask Wolfram|Alpha about “heating oil prices in New York”, for example, and you’ll see that as of November 1, the statewide average price was about $3 per gallon—slightly higher than at the start of last winter, but quite a bit below the peak in late winter of 2008. Propane prices are also higher than a year ago, and you can also see that prices climbed dramatically over the course of last winter. You can keep checking back over the course of the season to see which way prices are trending in your state.
(Note that the jagged appearance of heating oil and propane plots is due to the fact that prices are only reported for part of the year; these prices are also reported for only about 20, mostly northern, U.S. states.)
You can also ask Wolfram|Alpha about natural gas and electricity prices. The EIA keeps these figures less up to date than figures for heating oil and propane, but you can clearly see long-term price trends and seasonal fluctuations for both of them. More »
 1
1
On August 2, The New York Times reported that the (near) final estimate for the total amount of oil leaked into the Gulf of Mexico as a result of British Petroleum’s (BP) Deepwater Horizon drilling accident is approximately 4.9 million barrels. It would be nice to understand what this number means in the context of the commodity markets where oil is traded. It would also be nice to better understand what this oil spill did to BP stockholders.
Wolfram|Alpha can help answer these questions. For example, someone might wonder what all this oil would be worth on the oil market. The input “price of 4.9 million barrels of oil” tells us that the value of this oil on the oil futures market is around $398.8 million (at the time this was written). That’s a lot of money just floating around the Gulf! But to be fair, much of it was cleaned up. Wolfram|Alpha also shows a graph of how the value of this oil has fluctuated over time as well as the latest quote of a barrel of oil on the New York Mercantile Exchange.
Someone might wonder whether the amount of spilled oil was enough to affect the price of oil in the U.S. The input “oil futures open interest” gives us the number of oil futures contracts currently in existence for the front-month contract. 
As the graph illustrates, open interest starts out strong every month (as the front-month contract rolls forward to the next month). As the contract approaches expiration, some people close out their positions while others roll their positions forward into a future month’s contract. The best measure of open interest would be the higher numbers shown immediately after the front-month rolls forward (especially since other contract months aren’t accounted for here).
More »
 6
6
In any news report about the Deepwater Horizon oil spill, a lot of statistics get thrown around—mainly about the rate at which oil has been spewing out of a pipe on the floor of the Gulf of Mexico. Recent estimates put the flow up to 60,000 barrels per day, but it’s hard for most of us to comprehend exactly what that number means. Wolfram|Alpha has always been able to provide some useful comparisons for any quantity you care to input, and can easily tell you that 60,000 barrels of oil is roughly equivalent to 3.8 times the volume of an Olympic-sized swimming pool.
With the recent addition of data on production and consumption of energy resources in every country, Wolfram|Alpha can also give you a more precise socioeconomic context for numbers like this. Try “60000 barrels per day / US crude oil production”, for example, and you’ll learn that the daily output of the leak is a little less than 1.2% of total crude oil production per day for the United States.
You can also get a better sense of global production or consumption of petroleum products, as well as information on coal and natural gas.
Because each of these energy resources is measured in different units, it can be difficult to understand exactly how they compare to one another—so Wolfram|Alpha can also compute the energy equivalents of each resource, measured in quadrillions of BTUs. For example, you can compare the United States consumption of energy from coal, natural gas, and petroleum on a single scale to better visualize the relative importance of each resource. More »


